
How to Measure Event Success in 2026
Headcount is a starting point, not a finish line. The dealerships and brands winning the event game in 2026 are tracking leads, pipeline value, and real return on investment. Here’s how to build a measurement framework that actually proves what your events are worth.
Stop Counting Heads and Start Counting Dollars
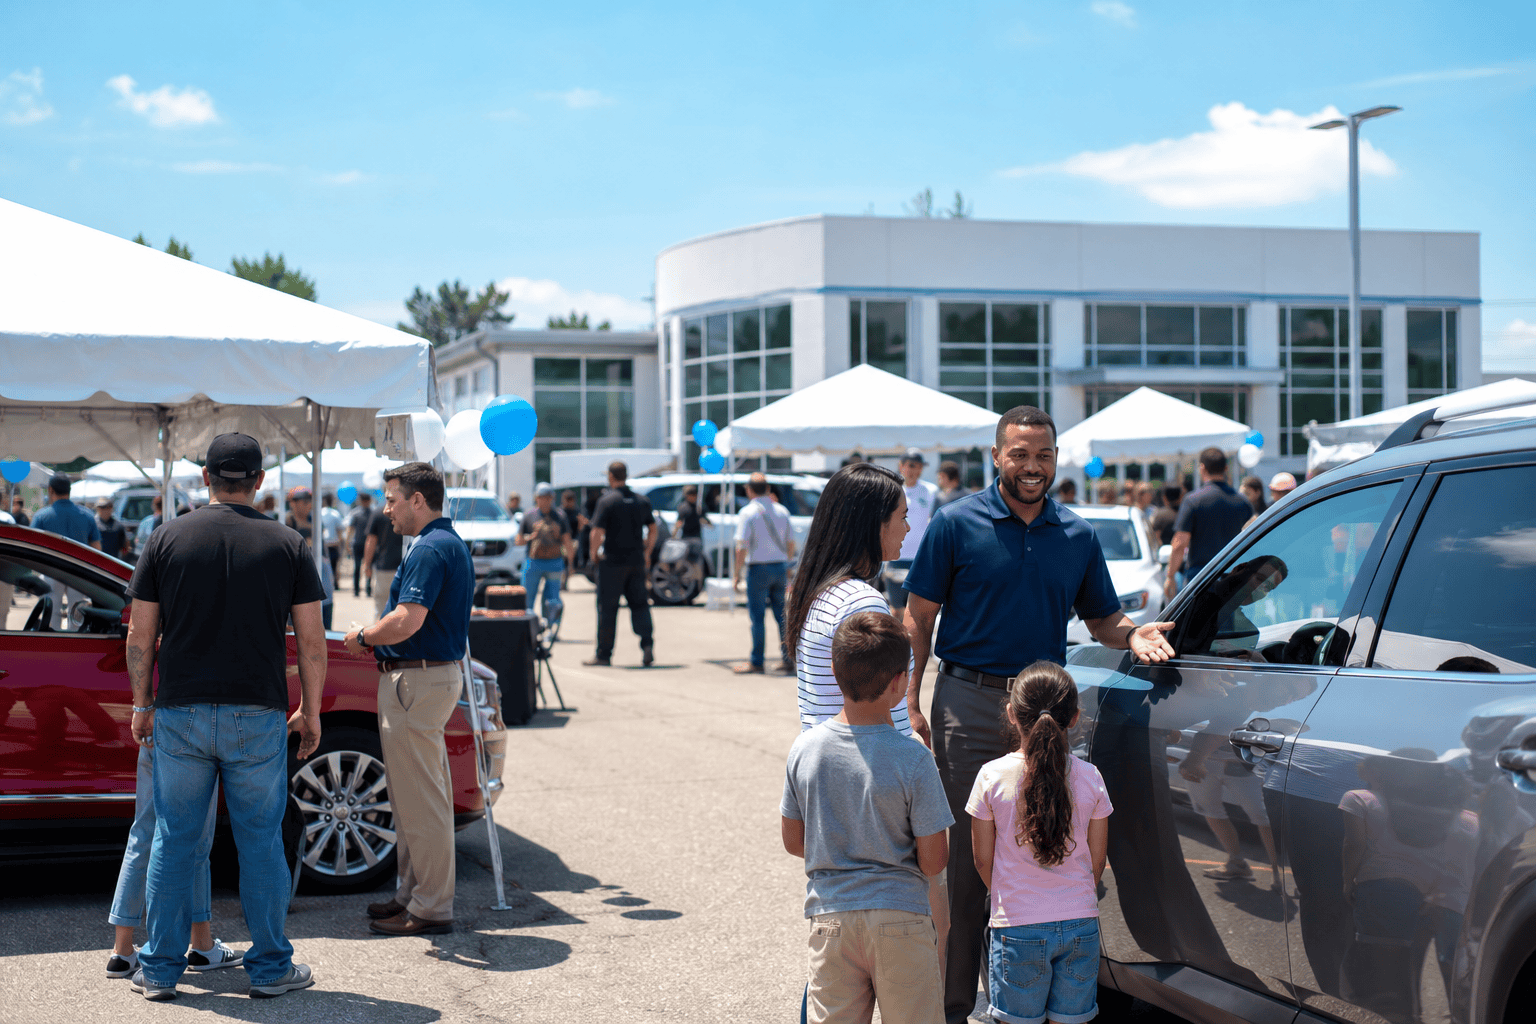
A packed showroom tent feels great. But if you can’t connect that crowd to appointments set, vehicles sold, and gross profit generated, you’re running on vibes. Event marketing in the automotive world is a serious budget line item, and every dollar spent needs a story attached to it.
The event marketing sector is on pace to hit $722.67 billion by 2026. More than 80% of organizers already call in-person events a top marketing channel. The pressure to show a clear return has never been higher, and the dealers who figure this out first are the ones pulling away from their competition.
Willowood Ventures has managed over $4 million per month in social advertising managed driving traffic to automotive events across 600+ dealerships nationwide. What we’ve learned is simple: the measurement process starts before the tent goes up, not after it comes down.
Define What Winning Actually Looks Like
You wouldn’t send a salesperson onto the floor without a monthly target. Don’t launch an event without a defined goal either.
Vague objectives like “create buzz” or “build awareness” are impossible to measure and impossible to defend to a GM or a dealer principal writing the check. Every event goal needs a number attached to it.
Here’s how to sharpen fuzzy goals into real targets:
- Instead of “generate leads,” aim for “collect 150 conquest leads with contact info and vehicle interest captured at point of entry.”
- Instead of “drive showroom traffic,” aim for “set 80 on-site appointments with a minimum 65% confirmed show rate.”
- Instead of “increase brand awareness,” aim for “grow conquest email list by 500 contacts segmented by zip code and model interest.”
That level of specificity does two things. It gives your team a concrete target to work toward, and it gives you an honest answer when the event is over. You either hit it or you didn’t.
Get stakeholder alignment before you spend a dollar. Sales, marketing, and management need to agree on what success looks like before the invitations go out. Mismatched expectations after the fact are a waste of everyone’s time.
Choose KPIs That Connect to Revenue
KPIs are only useful if they draw a straight line to a business outcome. Vanity metrics like total social impressions or booth walk-bys look good in a slideshow and mean almost nothing to a dealer principal.
For automotive event marketing, focus on these categories:
Pre-Event Metrics
- Registration volume vs. target capacity
- Confirmed appointments booked before the event date
- Ad cost per registration across your media channels
During the Event
- Appointments shown as a percentage of appointments set. Willowood consistently hits a 72% appointment show rate across active event campaigns, so use that as your benchmark.
- Leads captured on-site with vehicle interest and contact info confirmed
- Test drives completed per sales consultant working the floor
Post-Event
- Units sold within a defined attribution window, typically 30 days
- Gross profit generated tied to event leads
- Overall closing rate on event-sourced leads
- Cost per sale calculated against total event spend
That last one is where the real conversation happens. If you spent $15,000 on an event and closed 20 units at $2,500 front-end gross each, your event generated $50,000 in gross against a $15,000 investment. That’s a number worth putting in front of ownership.
What Real Results Look Like
Benchmarks matter. Here’s what Willowood Ventures-powered automotive events have actually produced for dealers:
- Little Rock Volkswagen: 64 units sold, $294,821 in revenue
- Salt Lake City GMC: 89 units sold, $421,593 in revenue
- Oklahoma City CDJR: 83 units sold, $398,762 in revenue
- Torrance Chevrolet: 72 units sold, $345,688 in revenue
Those aren’t projections. Those are closed deals with VINs attached. When you run a structured event with defined goals, targeted pre-event marketing, and disciplined BDC follow-up, the numbers follow.
Our standard campaign metrics across active event clients run at a 35% set rate, 65% show rate, and 15% overall closing rate on event-sourced leads. If your event is performing significantly below those numbers, the issue is usually in the follow-up process, not the event itself.
Build a Data Collection Process Before the Event
You can’t measure what you didn’t capture. Data collection has to be systematic, not an afterthought.
Set up your capture process across three points:
- Registration: Collect name, phone, email, vehicle interest, and timeline. Every field matters for segmentation later.
- On-site: Use a digital check-in tool that logs arrival time, assigns a salesperson, and timestamps every appointment interaction. Paper logs get lost and can’t be queried.
- Post-event: Push leads into your CRM within 24 hours. Tag them as event-sourced so you can pull a clean attribution report 30 and 60 days out.
Your BDC is the bridge between event traffic and closed deals. Willowood’s US-based BDC runs 24/7 ET, specifically to make sure no event lead goes cold. The window between initial contact and first follow-up call is shorter than most dealers think. Same-day response is table stakes. Same-hour response is the standard that actually moves the needle.
Calculate ROI and Use It to Improve the Next One
ROI on an automotive event is straightforward once your data is clean. Take total revenue generated from event-attributed sales, subtract your total event costs including marketing, staffing, and venue, and divide by total event costs. Multiply by 100 for your percentage return.
Willowood clients consistently see an average approximately 800% average return on ad spend on managed automotive event campaigns. That’s not an accident. It’s the result of precise targeting, structured follow-up, and a measurement process that starts at goal-setting and ends at the 60-day attribution report.
Use each event’s data to calibrate the next one. If your show rate underperformed, look at your confirmation call cadence. If your closing rate was low, look at the quality of leads being set, not just the quantity. Every event should make the next one more efficient.
For a deeper look at how targeted event strategies drive showroom traffic and measurable vehicle sales, check out the Willowood Ventures automotive event marketing guide. The framework is there. You just have to use it.
Make Willowood Ventures a preferred source on Google
One tap tells Google you want our dealership marketing coverage surfaced first. You will see Willowood Ventures more often in Top Stories, AI Overviews, and AI Mode when you search anything about selling more cars. It is free, it takes a second, and it brings you right back to this page.
Button not loading? Add willowoodventures.com as a preferred source here.
Frequently Asked Questions
Everything dealerships ask us about event success metrics.
function wvFaqToggle(el) {
var item = el.parentElement;
var allItems = item.parentElement.querySelectorAll(‘.wv-faq-item’);
var thisAnswer = el.nextElementSibling;
var thisIcon = el.querySelector(‘.wv-faq-icon’);
var wasActive = thisAnswer.style.maxHeight && thisAnswer.style.maxHeight !== ‘0px’;
allItems.forEach(function(it){
var q = it.querySelector(‘.wv-faq-question’);
var a = it.querySelector(‘.wv-faq-answer’);
var ic = it.querySelector(‘.wv-faq-icon’);
q.style.background = ”;
q.style.color = ”;
q.style.borderLeftColor = ‘transparent’;
a.style.maxHeight = ‘0px’;
a.style.padding = ‘0’;
if (ic) ic.style.transform = ”;
});
if (!wasActive) {
el.style.background = ‘#0085ca’;
el.style.color = ‘#ffffff’;
el.style.borderLeftColor = ‘#0085ca’;
thisAnswer.style.maxHeight = ‘1000px’;
thisAnswer.style.padding = ’30px’;
if (thisIcon) thisIcon.style.transform = ‘rotate(45deg)’;
}
}
{“@context”: “https://schema.org”, “@type”: “FAQPage”, “mainEntity”: [{“@type”: “Question”, “name”: “What are event success metrics and why are they important for car dealerships?”, “acceptedAnswer”: {“@type”: “Answer”, “text”: “Event success metrics are the specific, quantifiable data points that tell you whether a sales event actually delivered business results. For car dealerships, that means tracking appointments set, show rates, units sold, and gross profit generated, not just how many people walked through the tent. Without defined metrics, you’re spending real money on events and guessing at their value. That’s a hard position to defend to ownership at the end of the month. Willowood Ventures tracks a 72% appointment show rate across active automotive event campaigns. That kind of benchmark gives dealers a standard to measure against and a process to replicate. When you know your numbers, you can improve them.”}}, {“@type”: “Question”, “name”: “How do specific event success metrics methods benefit dealerships?”, “acceptedAnswer”: {“@type”: “Answer”, “text”: “Tracking the right metrics turns a one-time event into a repeatable system. When you know your cost per lead, cost per appointment, and cost per sale, you can make smarter decisions about where to spend your event budget next time. Dealerships that measure properly can also identify breakdowns in the process fast. If your set rate is strong but your show rate is weak, the problem is in your confirmation calls, not your marketing. You’d never find that without the data. Willowood-managed events at dealerships like Salt Lake City GMC and Oklahoma City CDJR produced 89 and 83 units sold respectively, largely because every stage of the funnel was tracked and optimized in real time. That’s what metrics-driven event management looks like in practice.”}}, {“@type”: “Question”, “name”: “What are the key components of a successful event success metrics strategy?”, “acceptedAnswer”: {“@type”: “Answer”, “text”: “A solid event metrics strategy has four components working together. First, you define specific, numbered goals before any money gets spent. Second, you select KPIs that connect directly to those goals, things like appointments set, show rate, and units sold within a 30-day attribution window. Third, you build a data capture process that’s systematic at registration, on-site check-in, and post-event CRM entry. If your data collection is sloppy, your analysis will be too. Fourth, you analyze the results against your benchmarks, calculate ROI, and document what to change for the next event. The goal is a process that gets smarter each time you run it. Willowood clients averaging approximately 800% average return on ad spend didn’t get there by accident. They got there by following this sequence consistently.”}}, {“@type”: “Question”, “name”: “How long does it take to see results from event success metrics?”, “acceptedAnswer”: {“@type”: “Answer”, “text”: “You’ll have preliminary results within 48 hours of the event closing. Appointments set, leads captured, and on-site test drives are immediate reads on event performance. The fuller picture takes 30 to 60 days. That’s the window where event-sourced leads close, deals fund, and you can pull a clean attribution report tying gross profit back to event spend. Anything shorter than 30 days undersells the event’s impact because not every customer bought on the day of the event. For BDC-driven follow-up, Willowood’s 24/7 operation running ensures that no lead goes cold during that critical post-event window. Speed and consistency in follow-up directly affect how many of those 30-day closes you actually capture.”}}, {“@type”: “Question”, “name”: “What kind of ROI can dealerships expect from professional event success metrics?”, “acceptedAnswer”: {“@type”: “Answer”, “text”: “Dealerships that run structured, metrics-driven events with professional support consistently outperform those running events on gut feel. Willowood Ventures clients see an average approximately 800% average return on ad spend on managed automotive event campaigns. In real numbers, that looks like Little Rock Volkswagen closing 64 units for $294,821, or Torrance Chevrolet closing 72 units for $345,688. Those results come from pairing strong pre-event marketing with disciplined data tracking and aggressive BDC follow-up. ROI varies based on inventory mix, market size, and event execution, but the framework is consistent. Define your goals, track the right KPIs, follow up fast, and measure everything. Dealers who do all four see returns that are hard to match with any other marketing channel.”}}, {“@type”: “Question”, “name”: “How does event success metrics differ from traditional dealership methods?”, “acceptedAnswer”: {“@type”: “Answer”, “text”: “Traditional dealership event measurement usually stops at units sold during the event weekend. That misses a significant portion of the actual return, since many event-sourced customers buy in the days and weeks after the event closes. A proper metrics framework extends the attribution window to 30 or 60 days, tracks every lead through the CRM, and connects gross profit, not just unit count, to event spend. It also looks upstream at pre-event performance metrics like cost per registration and appointment set rate, which give you the ability to optimize while the campaign is still running. The shift is from scorekeeping after the fact to active performance management throughout the entire event lifecycle. That’s a fundamentally different, and more profitable, way to run an event program.”}}, {“@type”: “Question”, “name”: “What role does BDC follow-up or audience targeting play in event success metrics success?”, “acceptedAnswer”: {“@type”: “Answer”, “text”: “BDC follow-up is where most of the money gets made or lost. You can run a perfect event and still leave gross on the table if your follow-up process falls apart after the tent comes down. Willowood’s US-based BDC operates 24/7, specifically to handle event lead follow-up during the critical post-event window. That consistent outreach is what drives the 72% appointment show rate and 65% show rate benchmarks across active campaigns. Audience targeting on the front end feeds the quality of leads your BDC is working. Willowood’s Meta Certified Partnership means conquest audiences are built with precision, so the people registering for your event are actually in the market for a vehicle. Better targeting upstream means better conversations downstream.”}}, {“@type”: “Question”, “name”: “How important is timing for launching event success metrics?”, “acceptedAnswer”: {“@type”: “Answer”, “text”: “Timing affects nearly every metric you’re tracking. The measurement framework needs to be set up before the event launches, not assembled afterward from whatever data happens to be available. Goals, KPIs, and data capture processes should all be locked in during pre-event planning, ideally two to three weeks before the event date. That gives your team time to configure the CRM tags, train staff on lead capture procedures, and confirm the BDC is briefed and ready to work inbound registrations. Post-event, the timing of your first follow-up call is critical. Research consistently shows that response time within the first hour dramatically improves contact rates. Build your measurement timeline to include a 30-day and 60-day attribution pull so you capture every deal that closes from the event, not just the ones that happened on the day.”}}, {“@type”: “Question”, “name”: “What makes event success metrics more effective than alternative methods?”, “acceptedAnswer”: {“@type”: “Answer”, “text”: “Most alternative approaches to evaluating events rely on partial data, either just the weekend unit count or broad digital metrics that don’t connect to revenue. Event success metrics work because they tie every activity back to a business outcome with a number attached. When you track set rate, show rate, and closing rate together, you can pinpoint exactly where your funnel is leaking. Willowood’s benchmark of 35% set rate, 65% show rate, and 15% overall closing rate gives clients a defined standard to optimize against. That specificity is what makes improvement possible. Beyond diagnostics, a metrics-driven approach also makes budget conversations easier. When you can show ownership a clear cost-per-sale figure and a documented ROI, the next event budget writes itself. That’s a competitive advantage that gut-feel event management simply can’t deliver.”}}, {“@type”: “Question”, “name”: “Why should dealerships choose Willowood Ventures for their event success metrics?”, “acceptedAnswer”: {“@type”: “Answer”, “text”: “Willowood Ventures is the premier choice for event success metrics because of our proven track record. We’ve served 600+ dealerships nationwide and managed over $4 million per month in social advertising managed driving traffic to automotive events. Our clients don’t guess at results. They measure them. Our managed event campaigns average approximately 800% average return on ad spend, and real dealer results back that up. Salt Lake City GMC closed 89 units for $421,593. Oklahoma City CDJR closed 83 units for $398,762. These outcomes come from a structured measurement process, a 24/7 US-based BDC, and our Meta Certified Partnership that ensures your pre-event audience targeting is built to convert. We don’t just run events. We build a repeatable system that makes every event smarter than the last. Contact us at 843-310-4108 to talk through what a metrics-driven event program looks like for your dealership.”}}]}
Ready to Transform Your Dealership’s Success?
Partner with Willowood Ventures, America’s #1 automotive marketing agency, and start filling your showroom with ready-to-buy customers. Our Facebook Sales Events deliver Set Appointments, not promises.